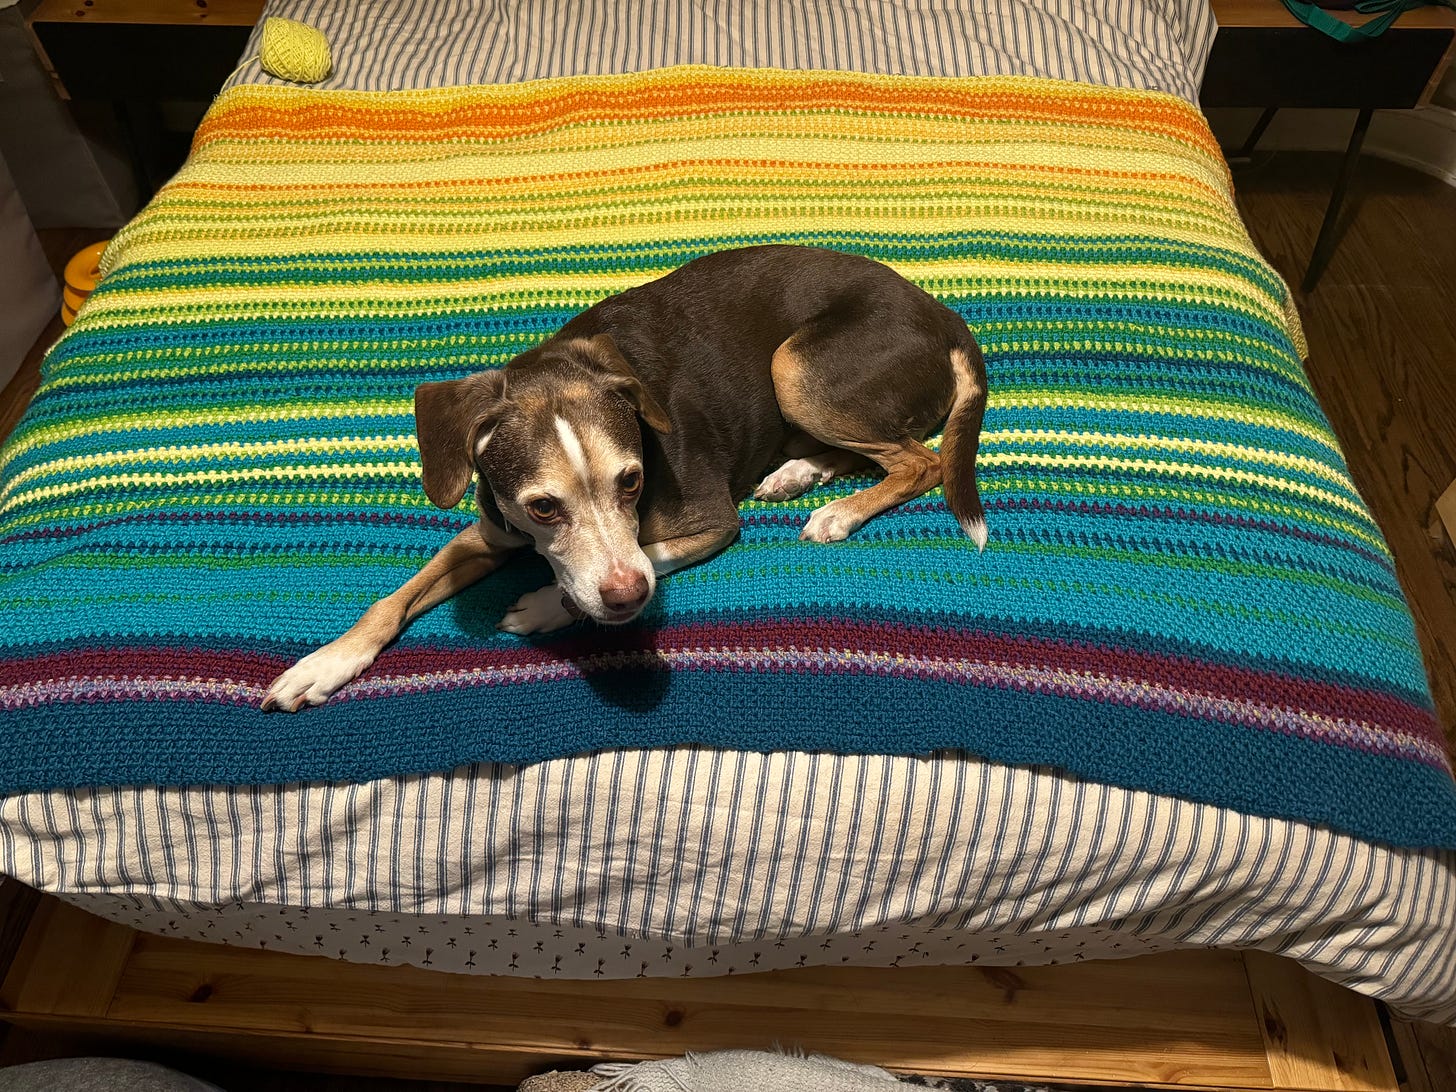
At the beginning of this year, I decided I wanted to commit to a year-long project called a temperature blanket. I assigned different colors in ten-degree increments and each row represents the day’s high temperature in my city. These projects have been popular among the crochet Facebook groups I’ve joined, and I wanted to give it a try.
The image above shows all the high temps from January 1 through June 30. The lower/earlier rows are in blues to represent colder weather, and the warmer yellows and oranges represent hotter temperatures. Here is the color palette I used:
Because 2024 is a leap year, the completed blanket will have 366 rows. Unfortunately, the edges (which you can’t see here) aren’t even, so I’ll add a border, which usually masks those uneven edges.
I’ve never undertaken a huge project because the few attempts I’ve made ended up with me quitting. I want to show myself that I can commit to making something besides hats and cowls!


I just checked and our average low is 44 and average high is 84. This summer was brutal with heat waves over 109F. I think that’s the point of temperature blankets, to show climate change over the years.
I love this! If I were to do this project, it would be limited to the highest temps. San Diego stays mostly 70 degrees and higher, with rare “cold” spells during the non-winter.